
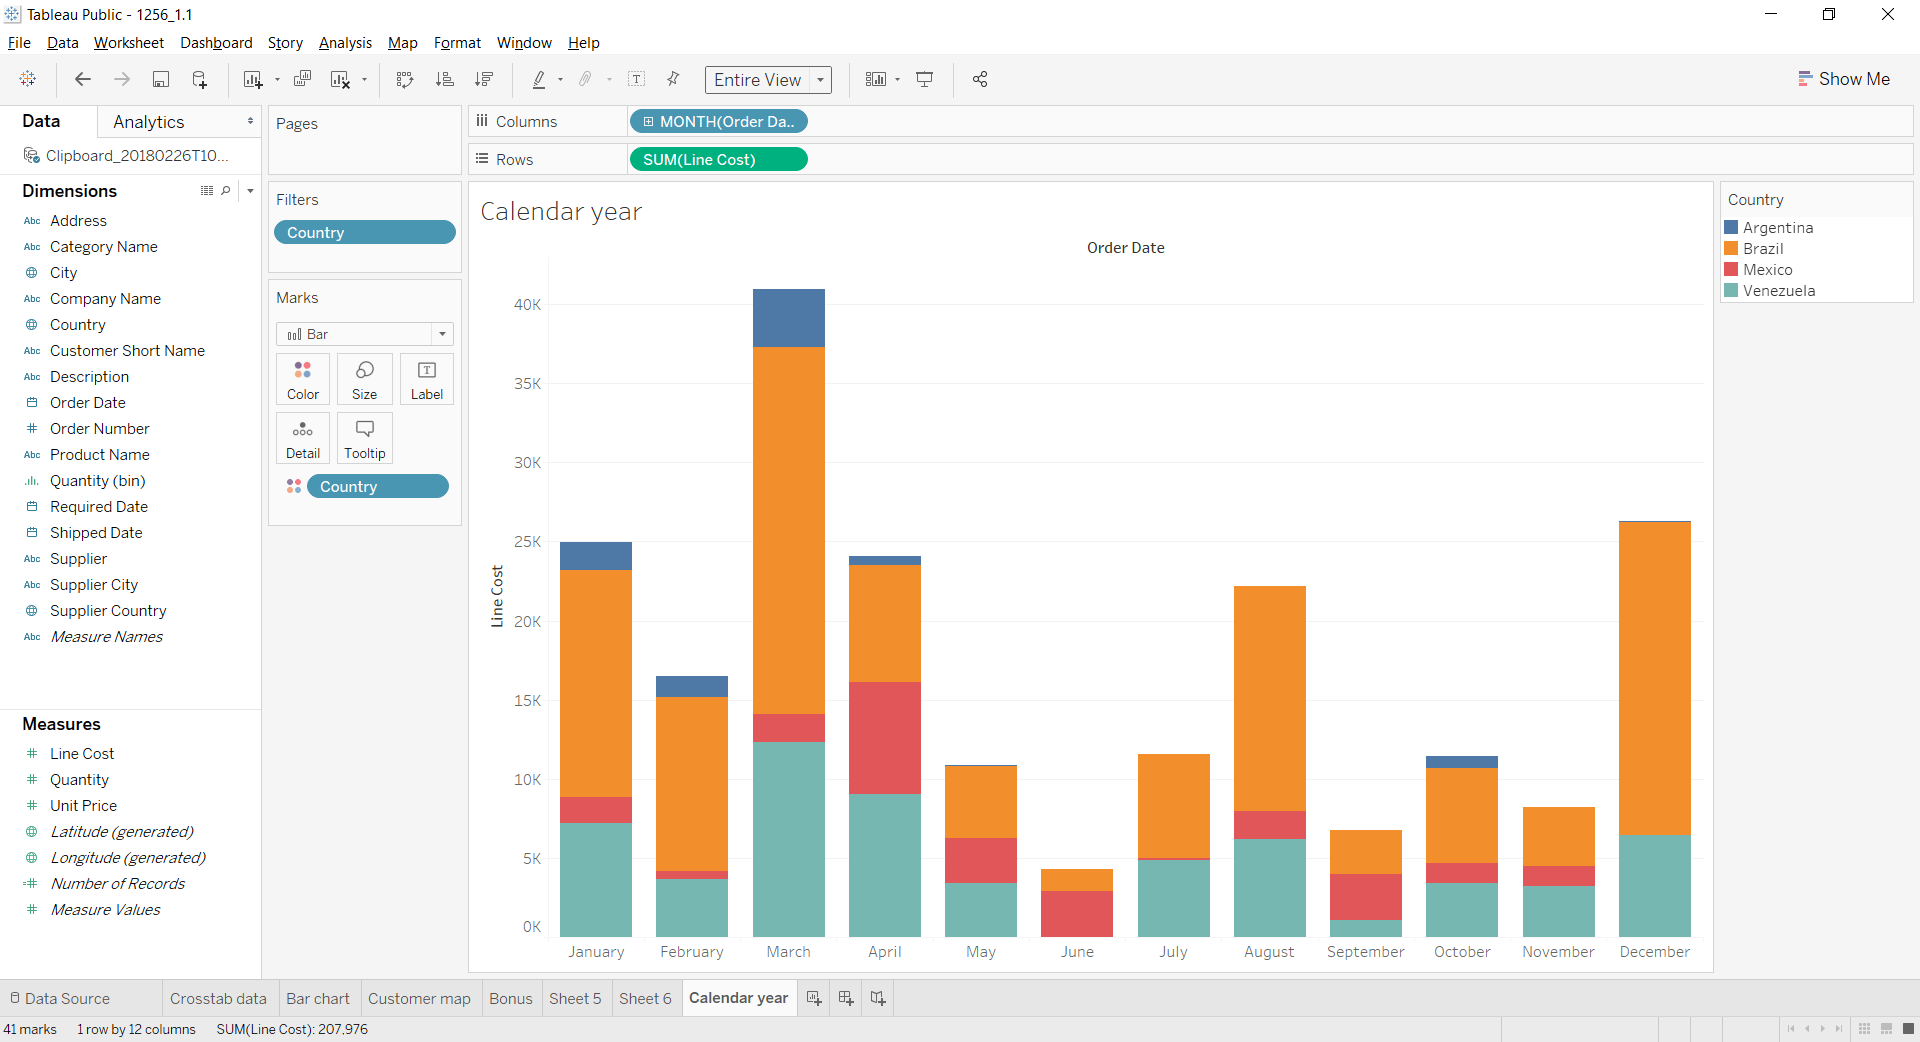
Let’s say we have the data set shown below and have created a simple visualisation with Order Date (Month) on the Columns shelf. So far, Order Date is based on Calendar Year, so when we are using Discrete Dates and show Month but not Year or Quarter, the chart starts in January.
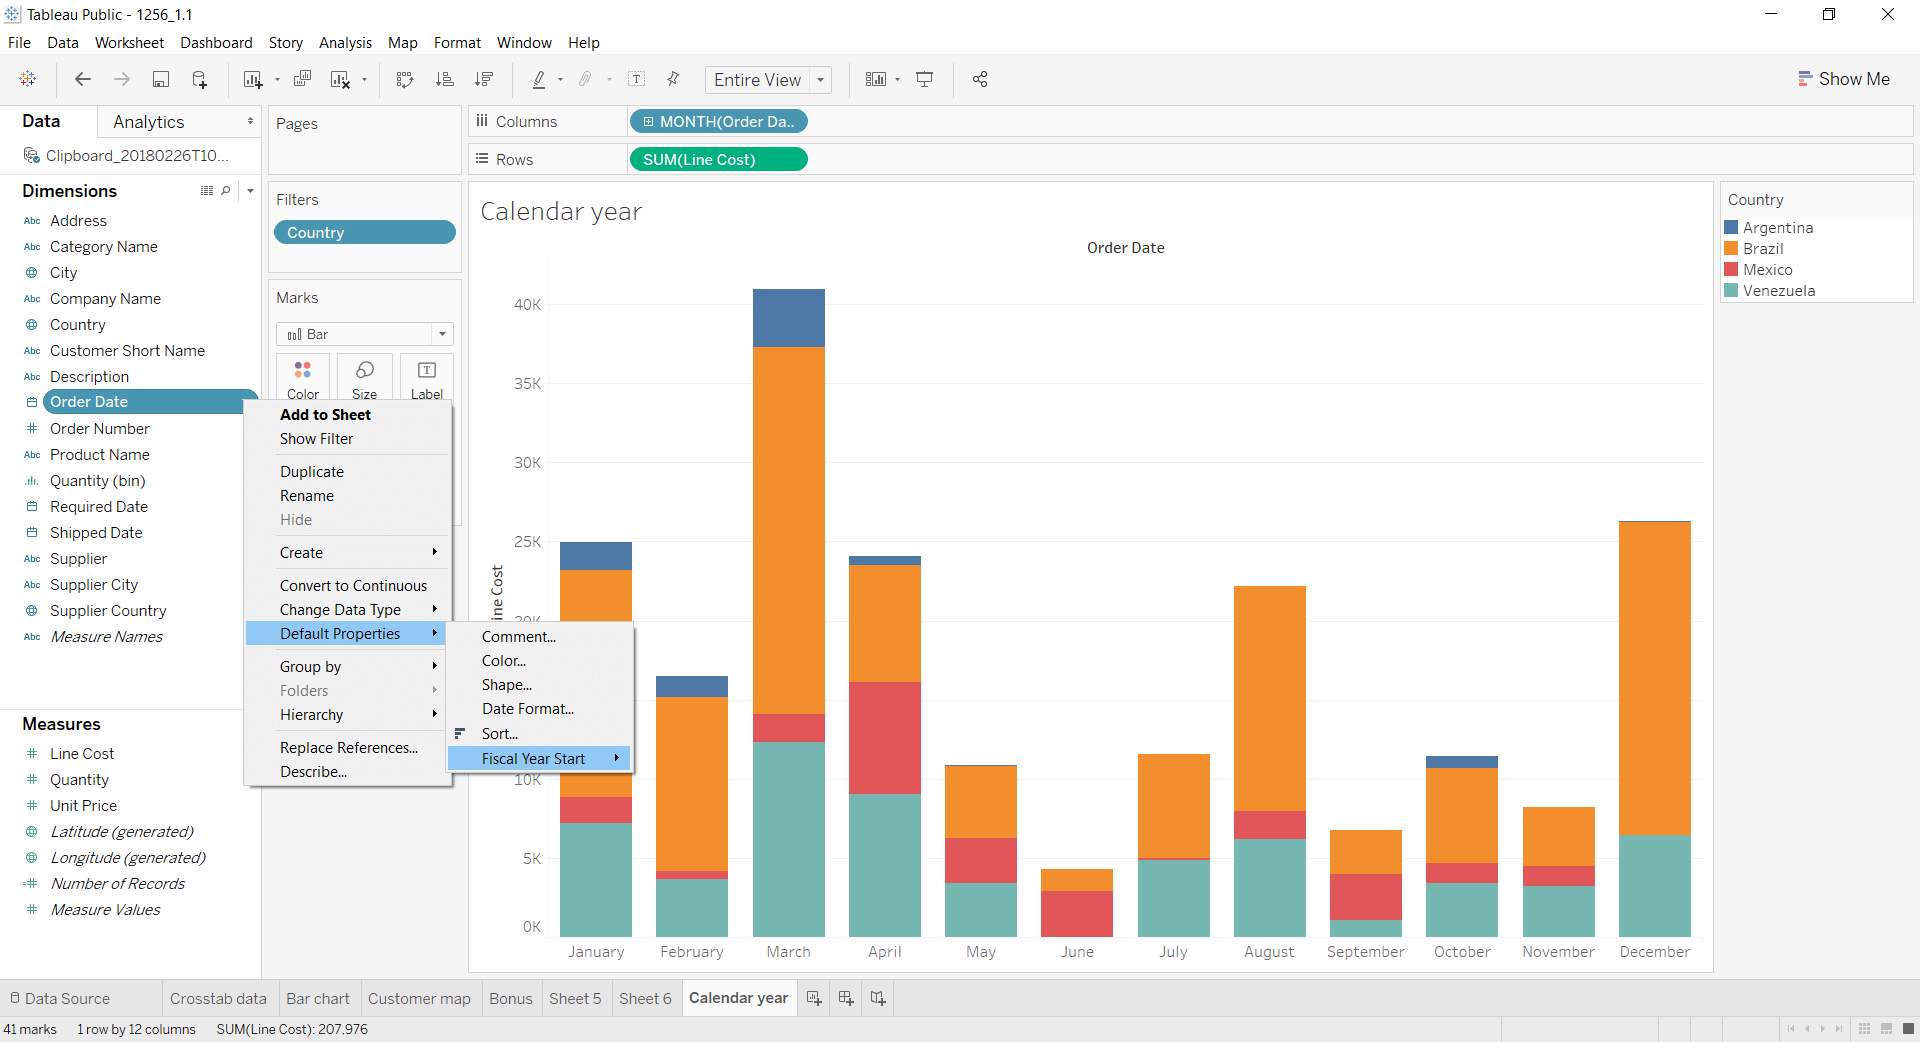
To change Order Date so that it shows dates based on a particular Fiscal Year, click the dropdown menu on the OrderDate pill under Dimensions and then Default Properties, Fiscal Year Start. Finally choose the month in which the company’s Fiscal Year starts. In this example I have selected May.
Now the chart will be redrawn to show the year beginning with May. (I manually changed the name of the worksheet before taking the screenshot below.)
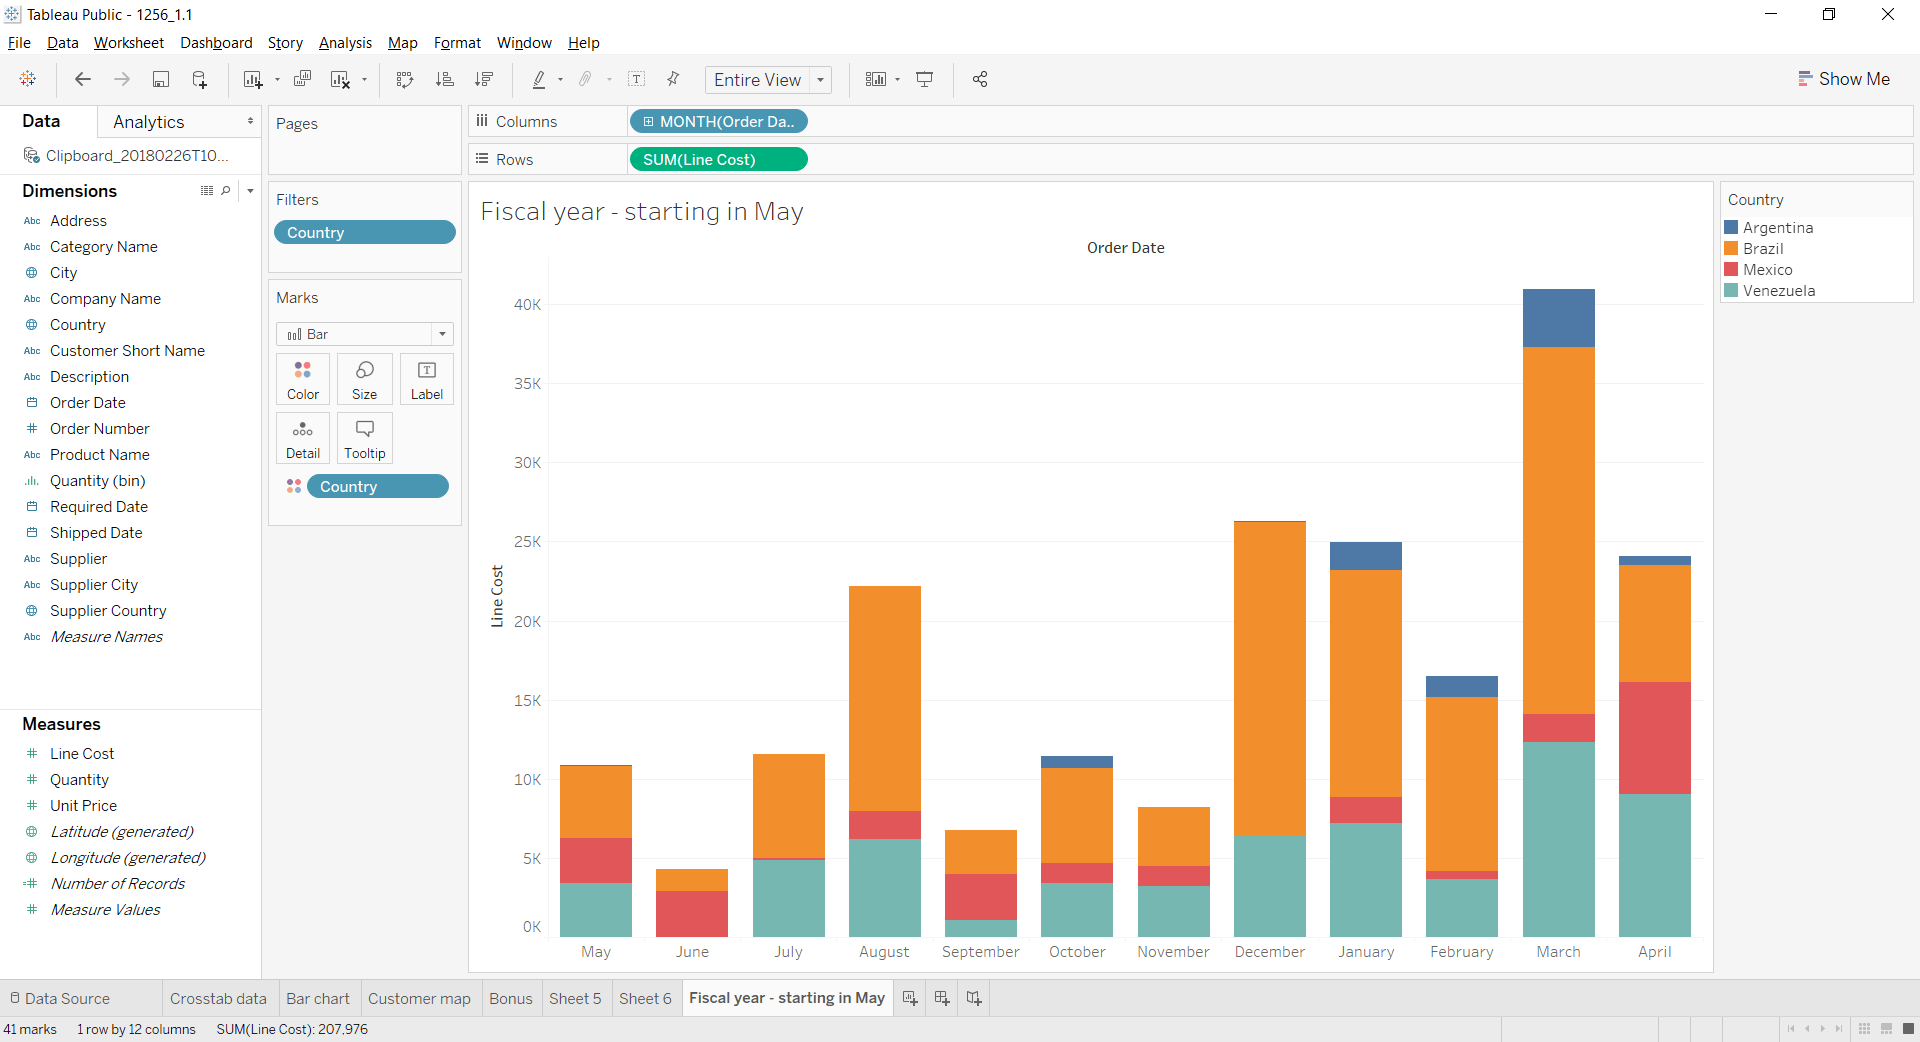
Note that in Tableau the Fiscal Year must start on the first day of one of the months, so this does not allow you complete freedom to set Fiscal Year, but it should be an improvement over only being able to use Calendar Year.