
Dashboard In A Day (DIAD): 7. adding a relationship to the data model
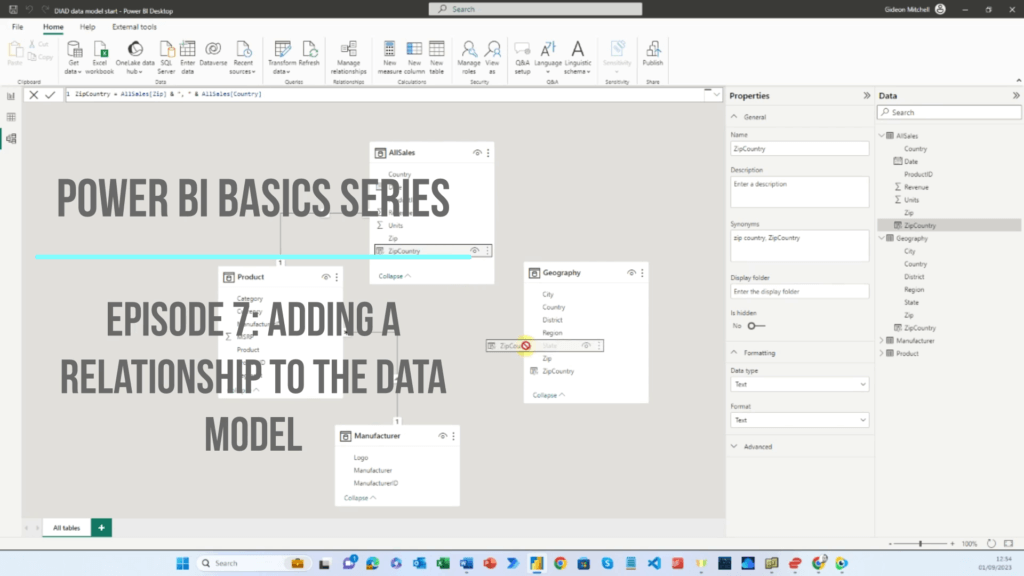
Episode 7 in a series about the basics of working with Power BI, mostly using the Dashboard In A Day (DIAD) dataset.
In this episode we come back to the DIAD dataset and check whether the data model is complete. We find that a new relationship needs to be added and in the process create two new calculated column formulas. We add the new relationship and find that the data model now works.
Dashboard In A Day (DIAD): 6. Using Power Query to append and merge data

Episode 6 in a series about the basics of working with Power BI, mostly using the Dashboard In A Day (DIAD) dataset.
In this episode we build on our new knowledge of the different types of join (from Episode 5) to apply merge and append to a real dataset using Power Query. We are using a different dataset from the one used previously. See the link below to download it.
Dashboard In A Day (DIAD): 5. The six types of Join query

Episode 5 in a series about how to use Microsoft’s Dashboard In A Day (DIAD) dataset to understand the basics of working with Power BI.
This episode explains what the six types of database join mean. We will need to understand this when we come to use Power Query to apply a Merge operation between two tables. It’s also really fundamental knowledge when you are working with databases.
Dashboard In A Day (DIAD): 4. appending data

Episode 4 in a series about how to use Microsoft’s Dashboard In A Day (DIAD) dataset to understand the basics of working with Power BI.
This episode shows how to append two tables of sales data into one.
Dashboard In A Day (DIAD): 3. Introduction to Power Query

Episode 3 in a series about how to use Microsoft’s Dashboard In A Day (DIAD) dataset to understand the basics of working with Power BI.
This episode is an introduction to Microsoft’s Power Query ETL (Extract, Transform and Load) tool that is embedded in Excel and Power BI. I take you through a set of simple transformations that we need to apply to the DIAD dataset. At the end I explain how to use the Data Profiling tools, which are very helpful in understanding whether a field has unique values and can be used as the Primary Key of a table.
Dashboard In A Day (DIAD): 2. connecting to data

Episode 2 in a series about how to use Microsoft’s Dashboard In A Day (DIAD) dataset to understand the basics of working with Power BI.
In this episode we take the first substantial step in a Power BI project and connect to the data, using a large CSV file, an Excel workbook with multiple pages and a folder containing several CSV files that we will get the system to automatically combine together.
Dashboard In A Day (DIAD): 1. data setup
Episode 1 in a series about how to use Microsoft’s Dashboard In A Day (DIAD) dataset to understand the basics of working with Power BI. See the links below the video to download the dataset.
In this episode we take a look at the tables in the data and work out the operations that we will need to apply in Power Query to get the data ready to be loaded into the Power BI data model.
Why should your organisation invest in Power BI?

What value can Power BI deliver in the organisation and how should we use it?
Setting cross-filtering in Power BI to ‘both’
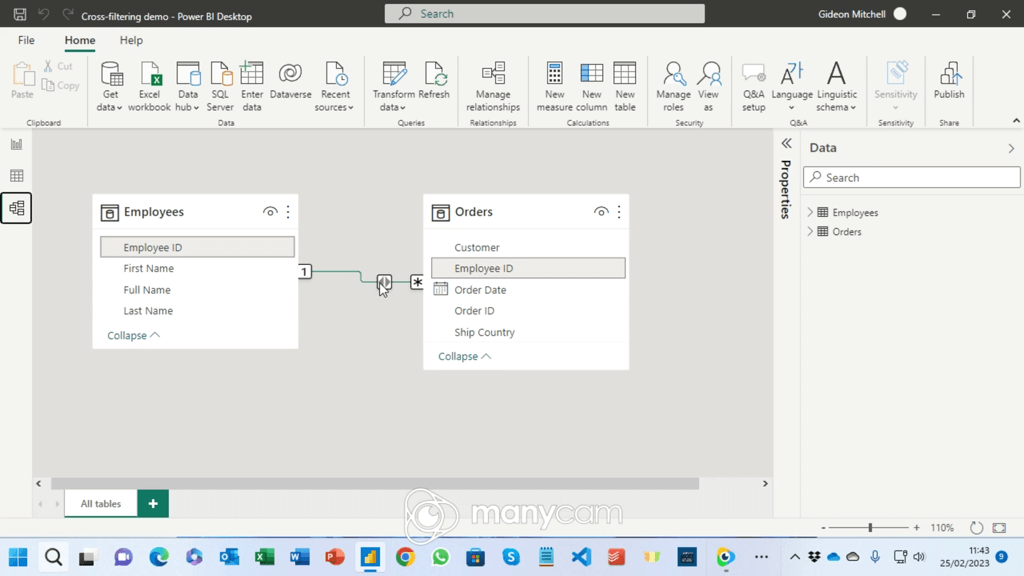
In a Power BI data model a one-many relationship can have its cross-filter property set to ‘single’ or ‘both’ and invariably I find that the ‘both’ setting confuses people. So let’s set up a really simple data set and see how this works in detail.
Making sense of Microsoft’s courses on Power BI
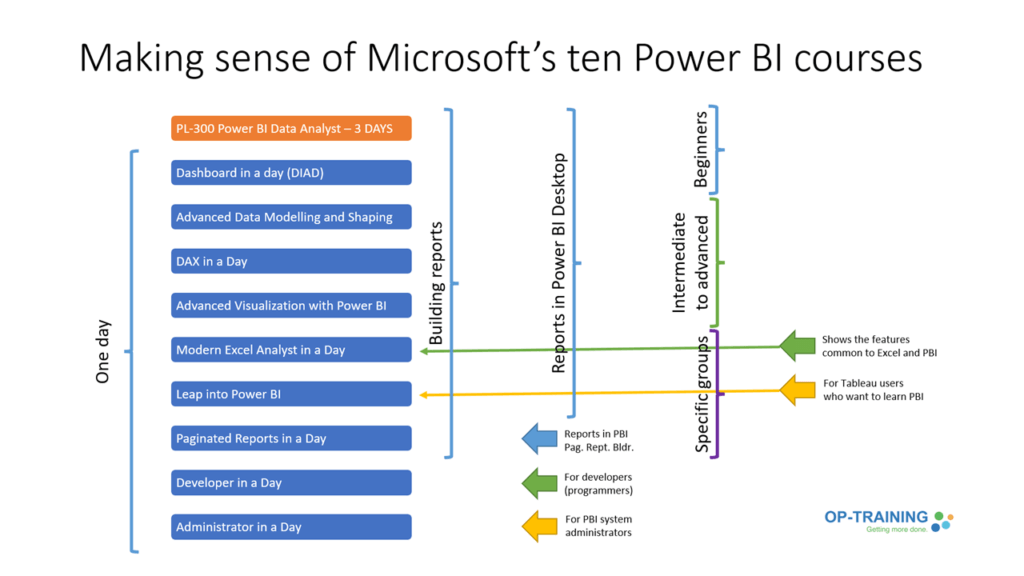
Microsoft’s courses about Power BI are multiplying at a bewildering rate and it is increasingly hard for prospective students to work out which one is appropriate for them. I have made a quick video here that breaks them down by content and level of experience.